

Predictive Maintenance
Mobius Institute Has Released a New Vibration Matters Newsletter Which Continues to Look at System Dynamics
In this issue, we will examine phase and the vibration signal, the value of Bodé plots, and the dynamic response of rotors. Earlier they have looked at the natural frequency and the effect of mass, stiffness and damping.
Phase relationships and vibration signals
Do you remember the relationship between displacement, velocity and acceleration? You may remember that velocity leads displacement by 90°. Acceleration leads velocity by 90°, which means that acceleration leads displacement by 180°. For this reason, as you may remember, when you integrate acceleration to velocity there is also a phase shift.
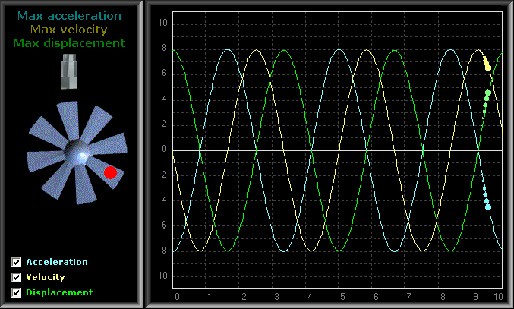
So, if we look at the equation again, we can see that the force related to stiffness is 180° out-of-phase with the force related to the acceleration of mass. And both are 90° out-of-phase with the force related to damping.
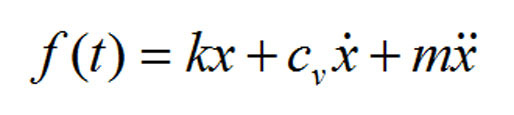
That’s why the force related to stiffness is 180° out-of-phase with the force due to the mass, and when they cancel (the natural frequency) the force is proportional to damping, which is 90° out-of-phase.
The Bodé plot
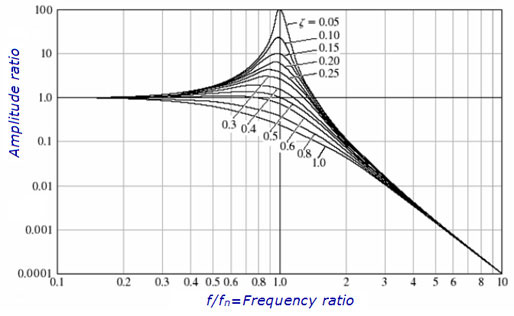
There is another way we can visualize this characteristic. It is called a Bodé plot. The Bodé plot includes a graph of magnitude versus frequency, and a second graph of phase versus frequency. We can see how the amplitude and phase change as the frequency is changed.
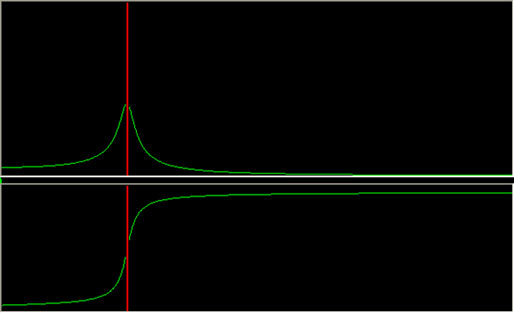
The Bodé plot is very helpful, as it shows us how the amplitude will change; the location of the natural frequency, and the effect of damping. For example, in the next image, damping is set to 0.025.
In the following image, it is set to 0.25
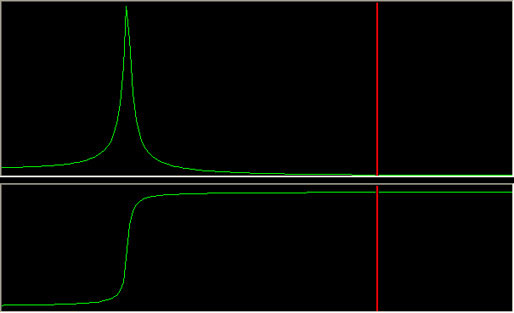
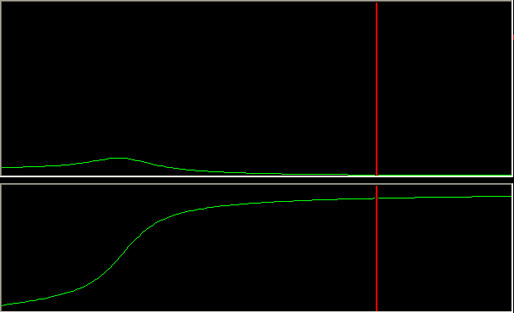
You can see the effect that damping has on the amount of amplification, and the rate of change of phase. If the system is lightly damped, the phase will not change until the frequency is close to the natural frequency.
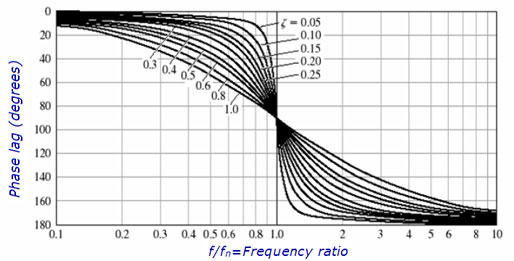
The Bodé plot provides a very useful way to display amplitude and phase data versus frequency. Later we will discuss run-up and coast-down tests where we excite a machine through a range of frequencies. The Bodé plot is key because not only do we see how the amplitude changes as the machine speed passes through a resonance, but we also see how the phase changes. The phase must change by 180° for it to be a resonance.
Dynamic response of a rotor
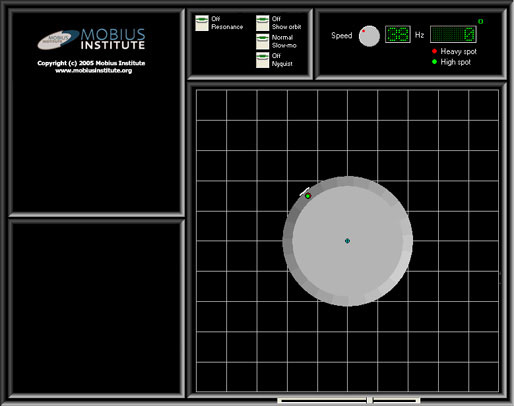
Let’s take a look at how the system response affects a rotor in a machine. Now we are looking at the shaft from an axial view point. We have added an amount of mass to create unbalance centrifugal forces. And we placed the reflective tape at the heavy spot – the point at which the out-of-balance mass exists. We will discuss phase measurements in more detail at another time, but we have placed the displacement probe in line with an optical tach. What would we measure? You would expect that the phase reading to be 0°.
In actual fact, the reading might be slightly different for a whole variety of reasons – there will be a slight lag between the heavy spot (the unbalance mass) and the high spot that we register with the displacement probe.
Let’s just step back a moment and make sure we understand the “heavy spot” and “high spot”. The high spot has been defined as “the angular location on the shaft directly under the vibration transducer at the point of closest proximity.” The displacement probe is sensitive to the high spot. The heavy spot has been defined as “the angular location of the imbalance vector at a specific lateral location on a shaft.” As we will learn, they are not the same angular location on the rotor.
As we increase the speed of the machine we naturally see the shaft turn more quickly, but we will also notice a separation between the heavy spot and high spot. Of course, the actually heavy spot does not move, but to the displacement probe it will appear as if it does.
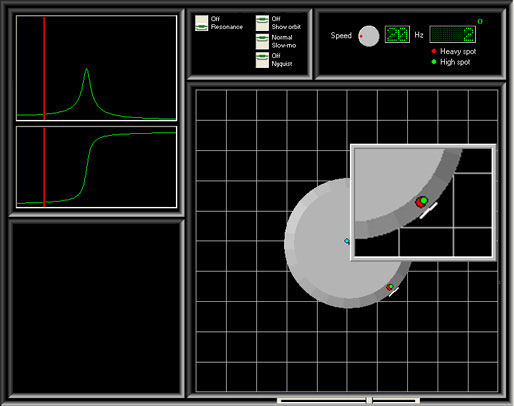
Up to a certain frequency, which is approximately 60% of the natural frequency, the rotor acts like a rigid rotor. There is only a small difference between the heavy spot and high spot, and the force is centrifugal. The heavy spot is at the outer radius of rotation. If we add the orbit display you can see that the heavy spot is traveling at the outer radius.
Another way to visualize what is happening is to imagine a roll on a balancing machine. Imagine that we have deliberately added weight to the inside of the roll such that we know the location of the heavy spot. As the roll increases in speed the rotation will follow the circular path shown. If we were to take a piece of chalk and move it just close enough to the roll so it barely touches, and then stop the roll, we would see a chalk mark at the heavy spot. At this stage it is acting as a rigid rotor.
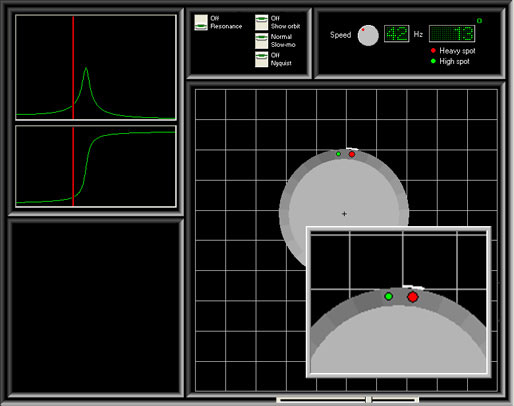
Now let’s increase the speed. As we increase the speed, the amplitude will increase quickly (depending upon the damping), but the high spot will begin to lag behind the heavy spot more dramatically. At the natural frequency, the high spot will lag the heavy spot by 90°.
If we went back to our example with the roll on the balancing machine, the chalk mark would be a quarter rotation behind the actual heavy spot (90° against the direction of rotation).
Now we can increase the speed of the rotor even further, as we pass the critical speed the lag will increase still further until it is 180°. Now the motion looks unusual. Now the shaft is rotating around the center of mass of the rotor. The center of mass is the point about which the mass is evenly distributed.
If we imagine the roll on the balance machine again, the chalk mark would be opposite the heavy spot. If we were actually attempting to balance the roll, we certainly need to be aware of where we are in relation to the natural frequency. If we are less that 60% of the speed then we could place a weight opposite the chalk mark in order to balance the rotor. If we are well above the natural frequency, we would place the weight at the chalk mark.
Click here for details: http://www.mobiusinstitute.com/site2/default.asp
Tagged Mobius, Newsletter, System Dynamics, vibration

Pingback: 123movies
Pingback: serviços informáticos